by John Youden - February 20, 2017
Puerto Vallarta Real Estate Trends 2017-2022
by John Youden - January 31, 2022
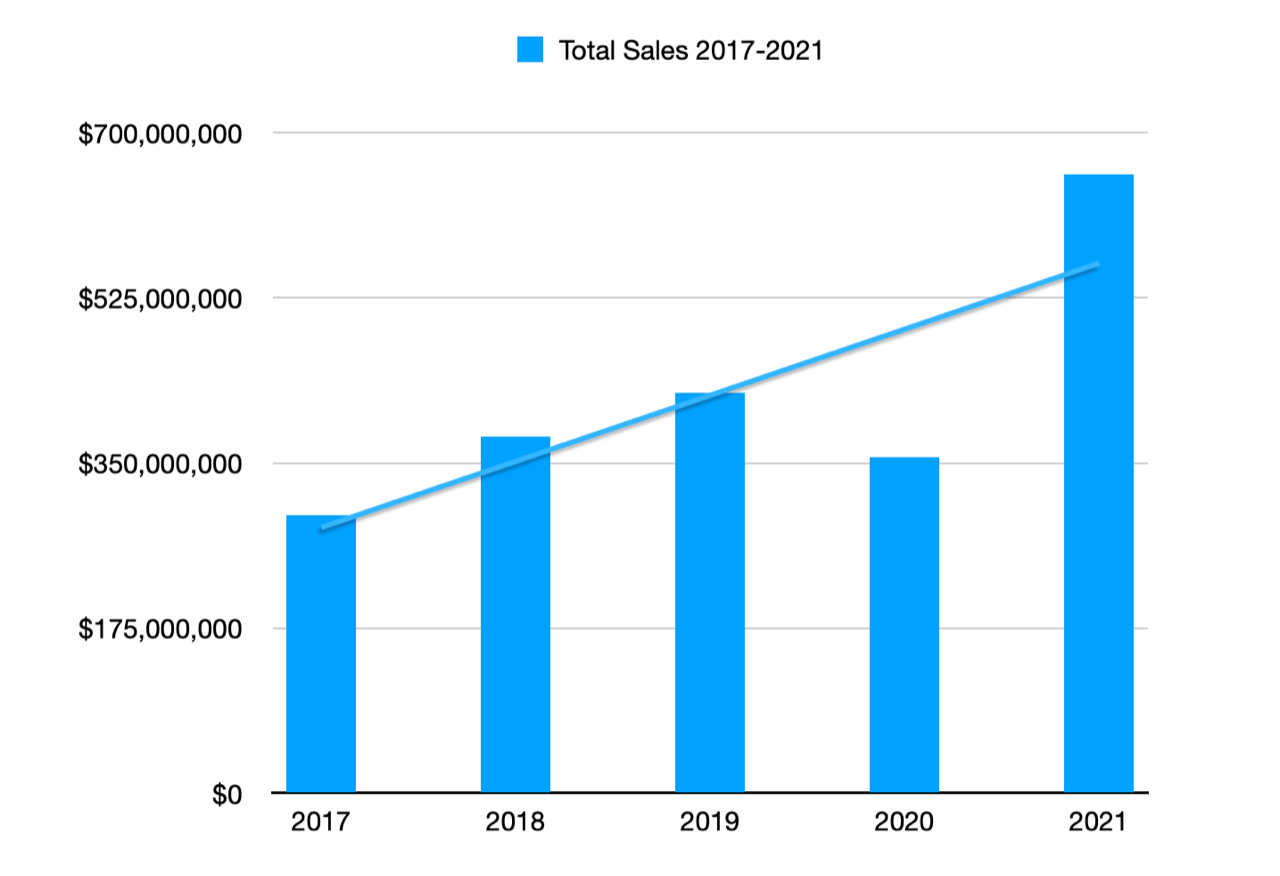
There's no question about it, Puerto Vallarta and Riviera Nayarit just finished up 2021 with a banner year, up more than 60% over the previous year. Sure, 2020 was hampered by covid, but it was still a pretty decent year. Whatever was lost in 2020 because of covid, as the chart below shows, was more than made up for in 2021, which outperformed even the trend line. This shows the gross volume of sales for the Puerto Vallarta/Riviera Nayarit region.
MLSVallarta, along with the assistance of a few FLEX MLS members, compiled the following data and charts regarding real estate sales for the Puerto Vallarta and Riviera Nayarit. The two regions, encompassing two different states and therefore with separate marketing and branding, are looked upon by the local real estate associations as one destination. Traditionally Puerto Vallarta has been the larger market with 70% of all sales in 2017. But that continued to drop to where it was responsible for just 63% of all sales in 2021.
With regards to sales volume, it has gone up by nearly 230%, from just under $400 million in 2017 to $615 million in 2021. Note: although the peso is the national currency of Mexico, the majority real estate here has been priced and sold in US dollars for quite some time. And as the market activity has increased, inventory levels have tried to keep up with numerous new projects in development, but currently demand is stronger than supply. Because of this the spread between listing price and selling price has narrowed. In 2017 the difference was 10%, but in 2021 in was down to 7%.
And as demand supersedes supply, prices go up. Today there are less properties available under $100,000 with the hottest range between $250-$500,000. But it is still a relatively inexpensive real estate tourism destination with 85% of sales under $500,000, and it has basically remained that way since 2017.
If we focus just on condominiums (which make up about 85% of the market), the average condo has gone up 25% over this period of time, as shown in the graph below.
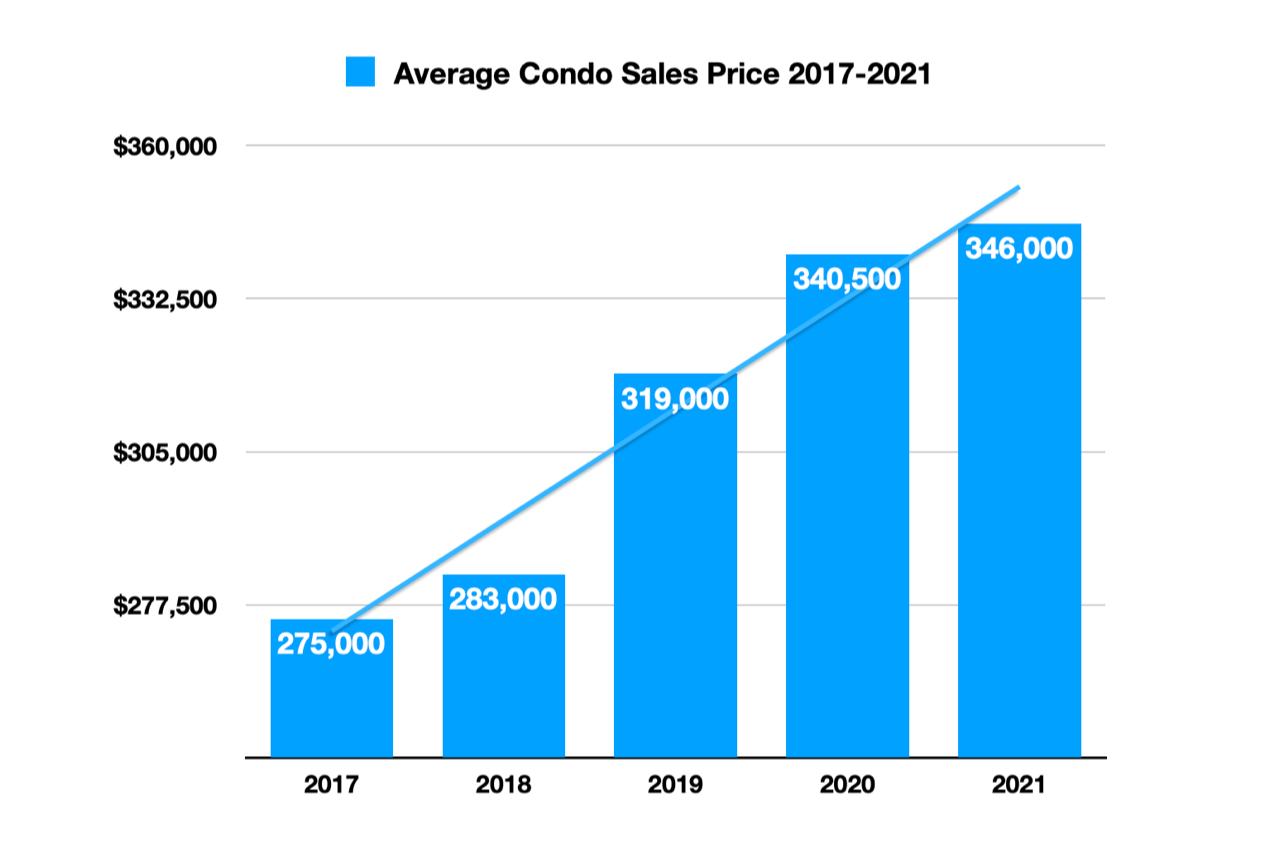
And if we limit our analysis to just two-bedroom condominiums (which make up about 50% of the sold inventory), they have gone up just over 20%.
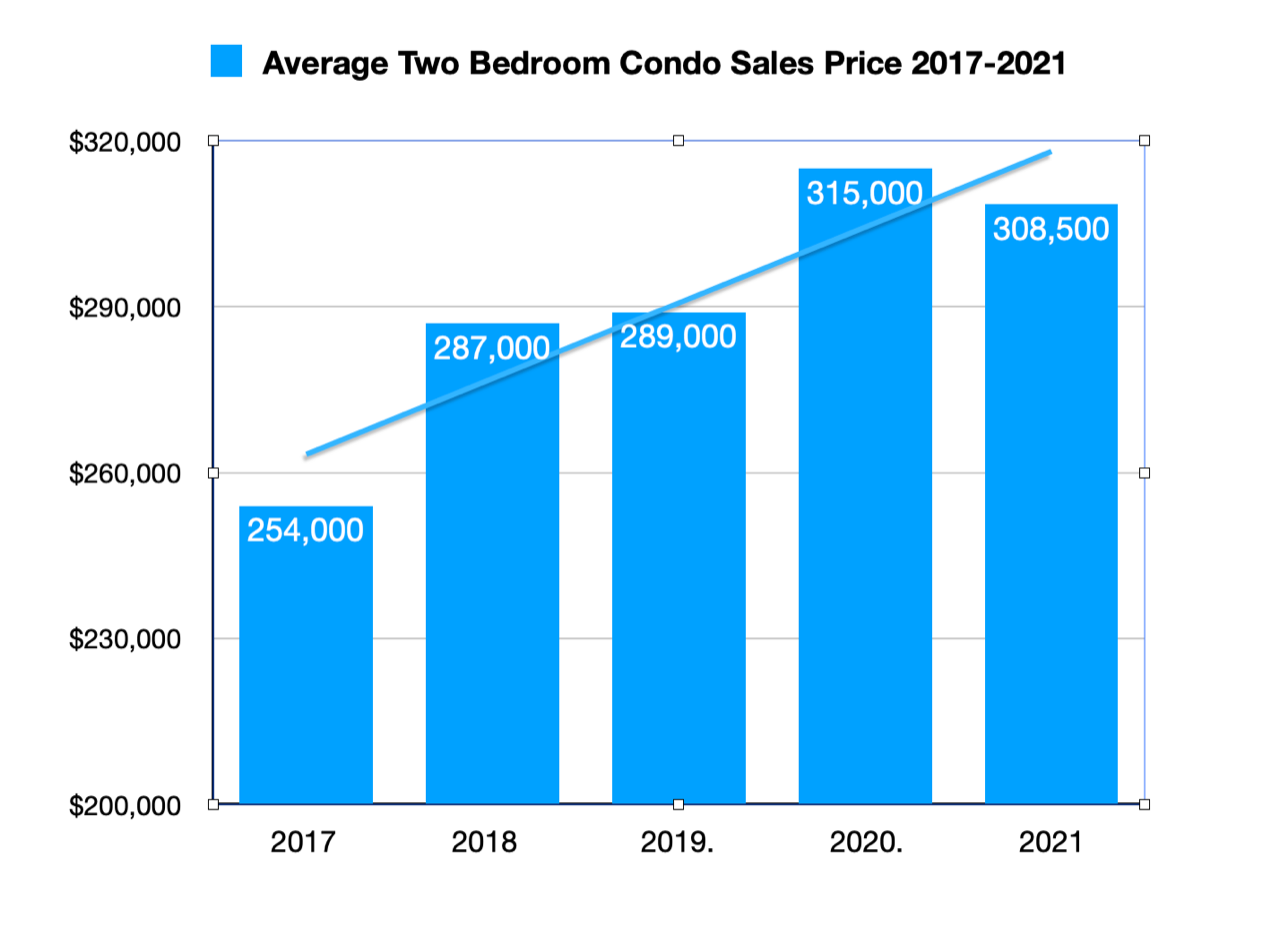
Two-bedroom units, as mentioned, account for half the condos sold, and that number has been pretty consistent over the past five years, as it has for other types of condominiums. Studios make up about 5% of the market, one-bedroom units - 25%, three-bedroom units - 17%, and units with four or more bedrooms account for just 3% of sold inventory.
What has changed is the sale prices. Studios have gone up 25% over this period of time, but one-bedroom units have gone up 40%, three-bedroom - 23% while the large 4-plus-bedroom units have gone up 33%.
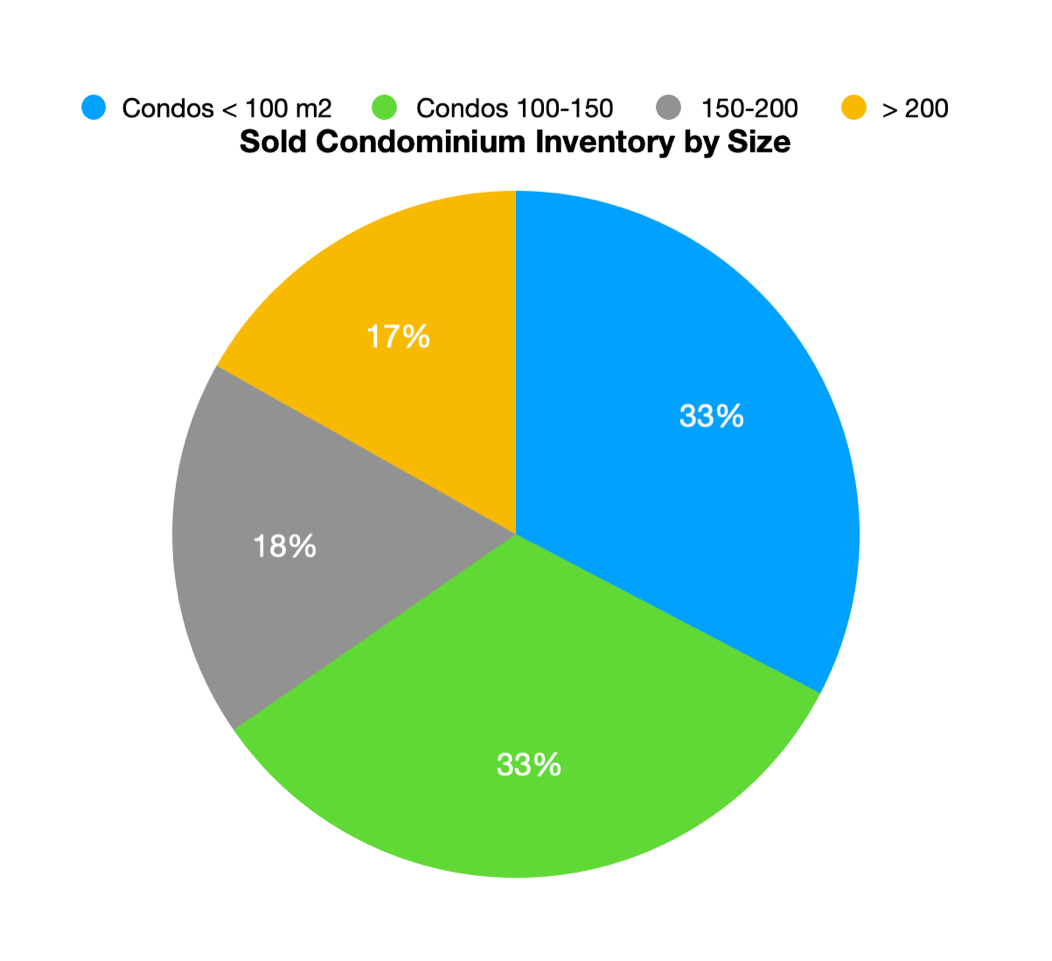
Regarding condominiums sizes, about a third of all condominiums sold were under 100m2, and another third ranged from 101-150m2. Condos from 151-200 m2 and over 200m2 evenly split the remaining one-third.
The following chart shows condominium inventory by price over time. Here we can see at the top, in green, that condominiums priced between $100,000 - $249,000, fell from having 47% in 2017 of the sold market to just 39% in 2021. Inventory for condos that sold for under $100,000 also fell, whereas condominiums prices between $250,000 and $499,000 rose from having just a third (33%) of all sales in 2017, to 42% in 2021. The other two price ranges rose as well, but to a much lesser degree.
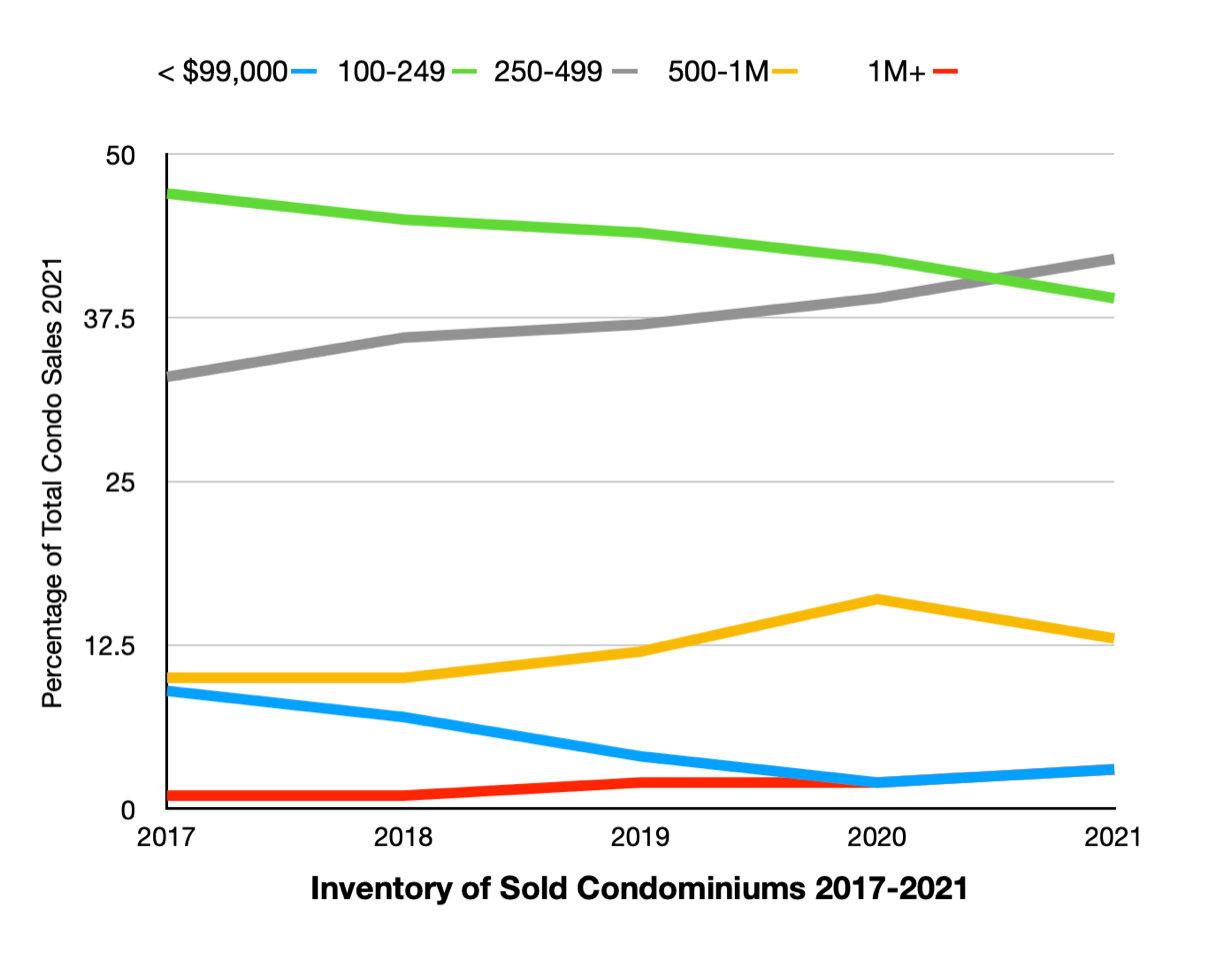
This makes sense as with all prices rising, there is going to be less lower-priced units available to sell. What's interesting is that much of the growth is centered around the $250,000 - $500,000 price range. This is the sweet spot. Puerto Vallarta and Riviera Nayarit, as mentioned previously, remain a region with relatively inexpensive pricing compared to other tourist/retirement regions. But it is slowly creeping up.
So where are all these condominiums situated that have been sold? We've been tracking the seven most popular regions over the past five years and they are: South Shore, Central South, Hotel Zone, Marina Vallarta, Nuevo Vallarta and Bucerias, along with the relatively new popular area Francisco Villa West, which includes Versalles and Fluvial, situated in between Francisco Villa and the Hotel Zone.
In 2017 these eight made up 85% of the sales of condos while in 2021 it was down to 72%. Some have dropped in number of sales, such as the South Shore that went from 14% down to 7%, and Central South which went from 22% of sales to just 14% (although it is still the most popular area). Marina Vallarta actually increased from 4% to 6% and we can see that from the number of condominium projects that have gone up here in the past few years.
If we limit our study to just four of the most popular regions (they have remained in the top four positions throughout the past five years), we find that in 2017 they accounted for 62% of all condominiums sales whereas in 2021 they accounted for only 42%.
So what's happening? Well, a few things. First, the market is becoming more diversified, spreading out to the north into Riviera Nayarit but also behind Vallarta in areas such as Versalles and Pitillal. Three of the popular regions mentioned above are located within Puerto Vallarta while just one is in Riviera Nayarit. But Nayarit is becoming more and more popular, as previously mentioned, up 7% to now account for 30% of all sales in the PV/RN region. Nayarit has more beaches and accessible coastline, but most importantly, it has the room to grow - there's more developable coastline in Riviera Nayarit than there is around Vallarta. Much of Vallarta's south shore is not even accessible by road. And the portion that is, is mountainous, limiting development to some degree. In Puerto Vallarta developers are moving into neighborhoods such as Versalles and constructing condominium towers, something now seen before. But for developers who want to build on oceanfront land, more and more they are forced to go to Nayarit.
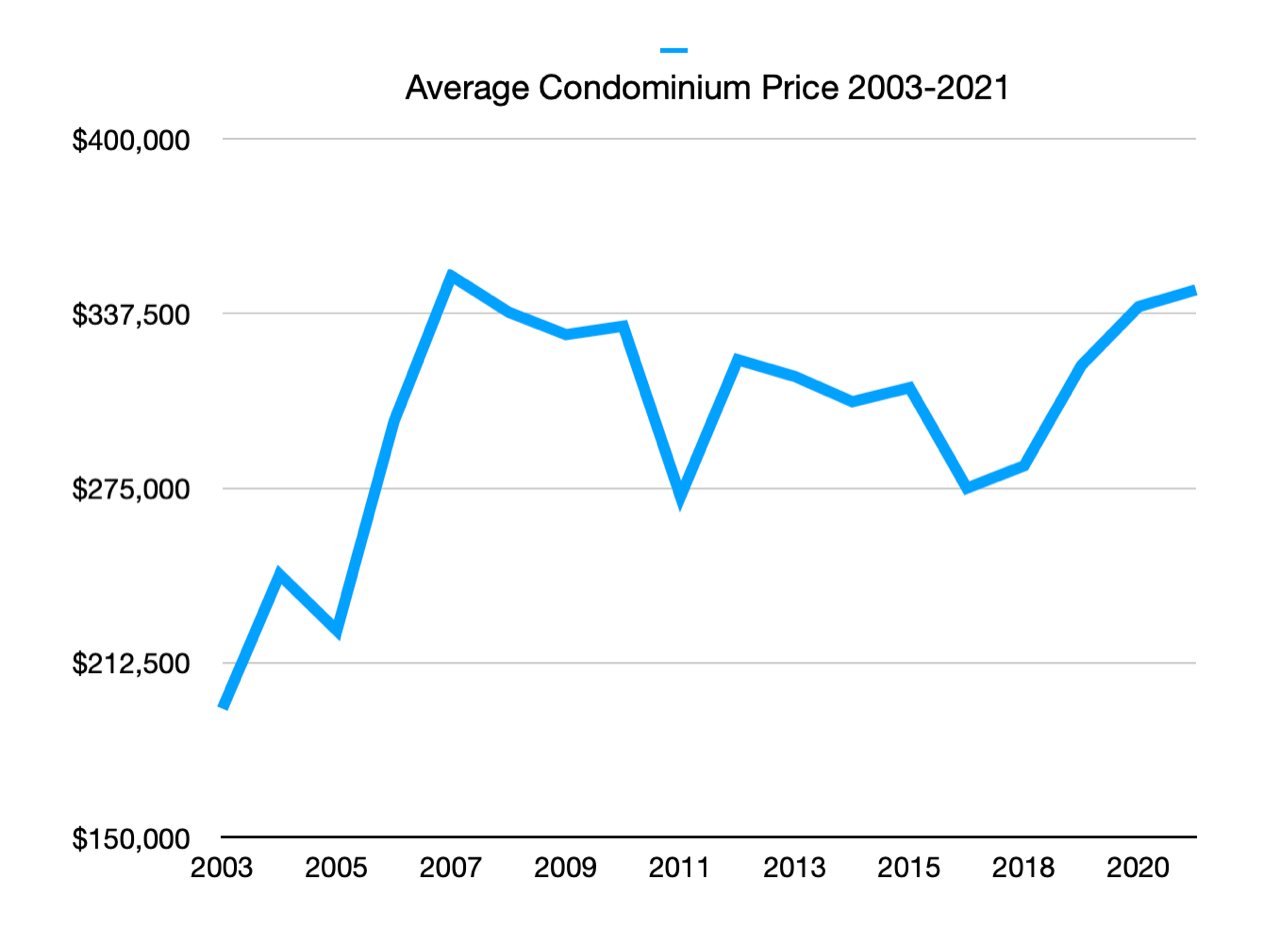
One final chart. This shows the average sales price for a condominium in the region since 2003. As you can see, prices climbed dramatically from 2003 to 2007. Prices then began to fall for the next ten years until 2017. To keep prices down developers that were building focuses on smaller units that were not oceanfront. But since then prices have been rising steadily once again.
Note:
These numbers do not reflect the sales that have taken place in the Punta de Mita region, more specifically the development of Punta Mita. These sales for the most part are not reported in either MLS system, however, if they were, are estimated to be between $200-250 million. They have been purposely left out as numbers are not available for the past five years. As well, not all real estate developers are part of the MLS systems available so their numbers are not reflected here. For these reasons these graphs are intended more to show trends over time rather than actual volumes.
Similar posts
by John Youden - February 8, 2020
